



Video Tutorials
Learn Ganttify with
Video Tutorials
See how to create Gantt charts, set dependencies, and stay on track.
Getting Started
Essential tutorials for new users to get up and running with Ganttify.
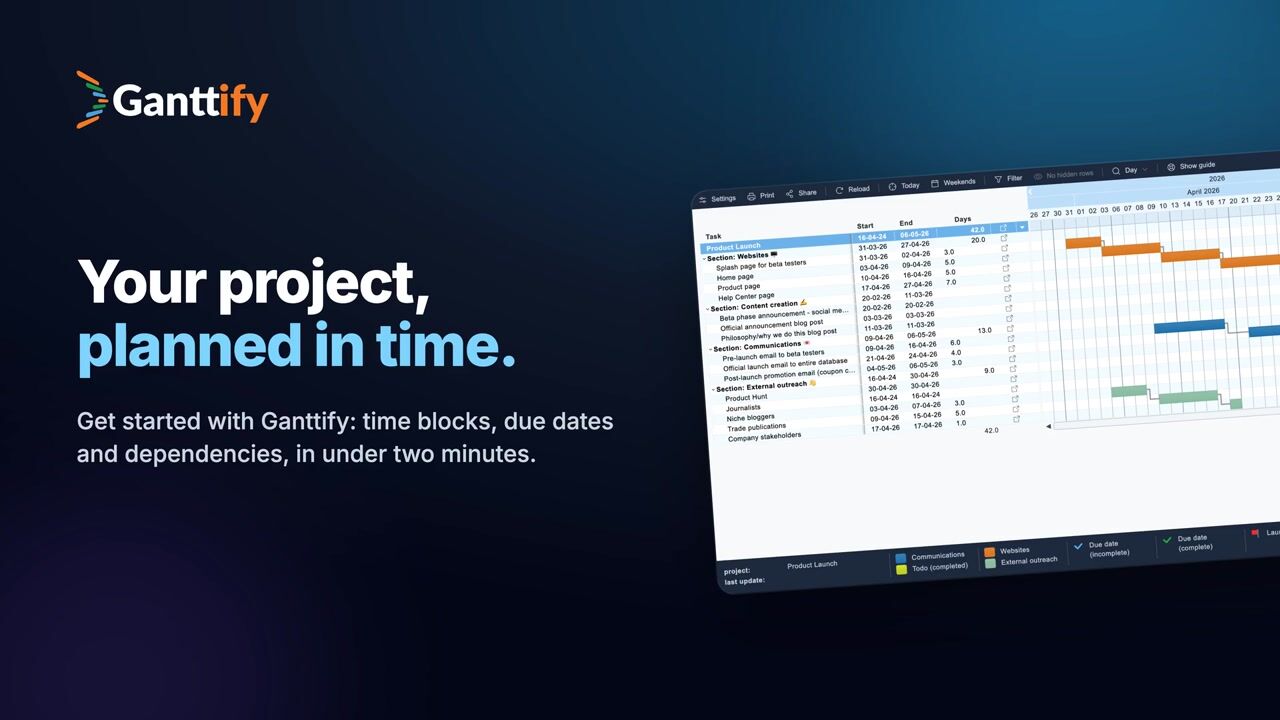
Create your first Gantt chart
Learn how to create your first Gantt chart in Ganttify: turn tasks into time blocks, set start and end dates, and add dependencies in under two minutes. Tasks with only a due date show as a checkmark, and tasks without dates get an empty row. Right-click an empty row and choose “Add time block”, then drag the block to move it or drag its edges to change the start and end dates. Right-click a checkmark to convert its due date into a time block, or right-click a block to turn it back into a due date. Link tasks with “Add dependency” so that when one task runs late, everything that waits on it moves along. Mark key dates like launch day with an icon, color the blocks that belong together, and name each color in the legend so everyone reading your chart knows what it means.
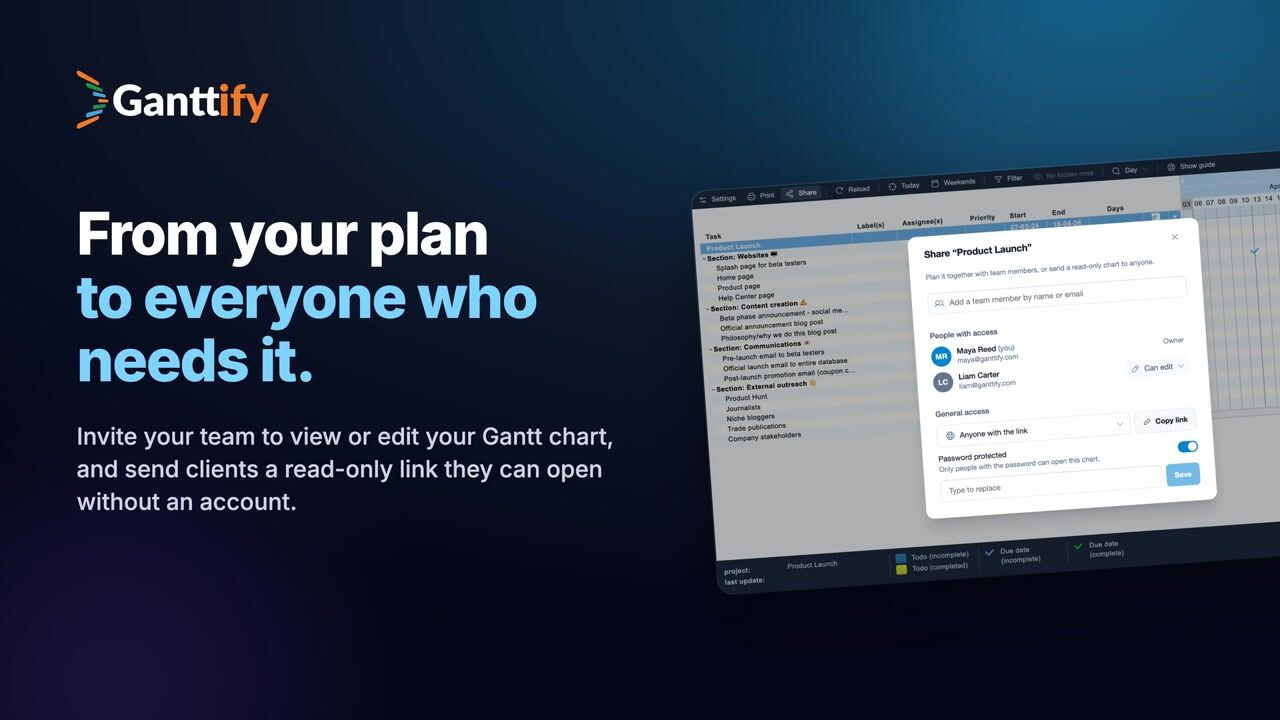
Share your Gantt chart with clients and your team
Share a read-only Gantt chart with clients and stakeholders who don’t use Ganttify. They open a link and see your live plan without an account. In the Share dialog, choose “Anyone with the link” and copy the link into an email. Your client opens it and sees the Gantt chart right in their browser, without signing up or logging in. The link always shows your live chart, so when the plan changes, your client sees the update and you don’t have to share anything again. For a confidential plan, turn on password protection, type a password and save. Give your client the password separately, for example by text message, so the link alone doesn’t open the chart. To share your Gantt chart with your team, click Share and type a team member’s name. Teammates join as Read-only and can follow the plan. Anyone who has access to your projects can be switched to Can edit to plan with you.
Quick Tips
Short videos with fast tips to quickly master common Ganttify actions.
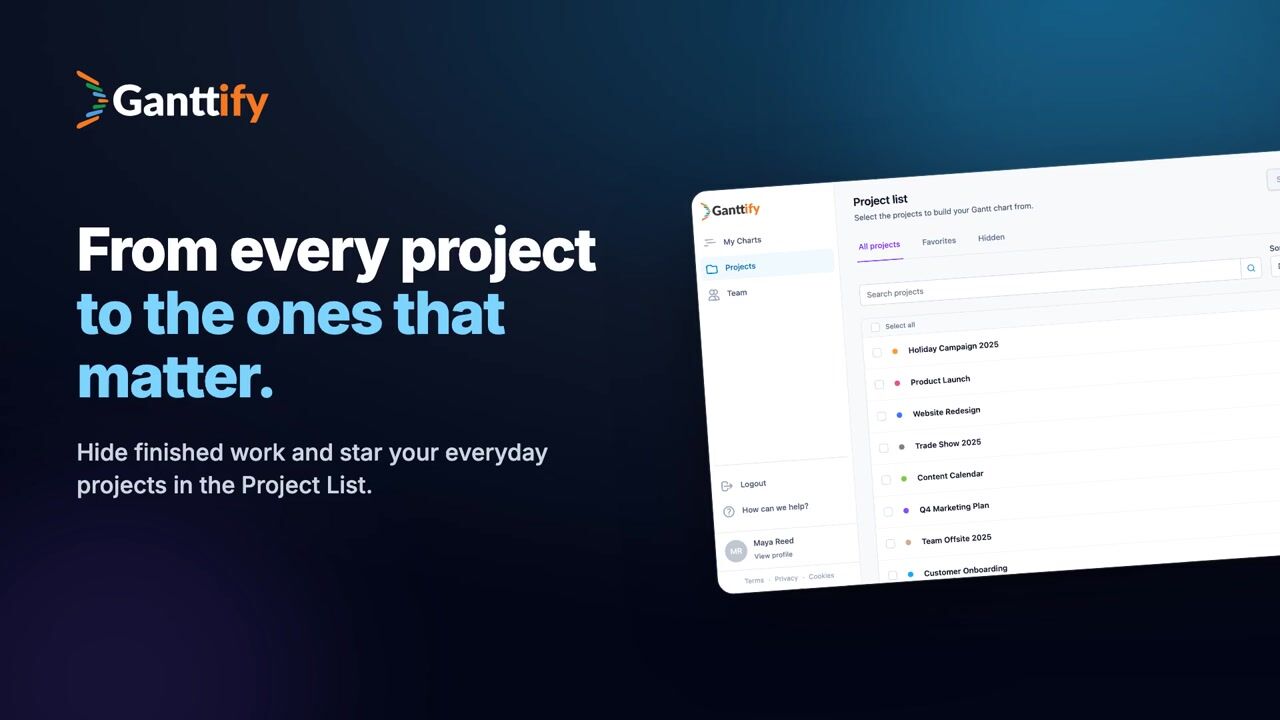
Hide finished projects from your Project List
Keep your Project List focused: hide finished projects, star the ones you use every day, and open your favorites together in one Gantt chart. Every project from your integration appears in the Project List, so over time it fills up with work that’s already done. Click the eye icon next to a finished project to hide it, and the list gets shorter right away. Hidden projects aren’t deleted: they stay under the Hidden tab, and you can bring them back anytime. To find a project, type a few letters of its name and the list narrows as you type. Click the star next to each project you work in every day to save it to Favorites, so it’s one click away next time. To plan across projects, go to Favorites, tick “Select all” and click “Open chart”. Your starred projects open together in one Gantt chart.

Navigate large Gantt charts
Struggling to find your tasks in a large Gantt chart? The timeline may simply be out of view. Use the navigation arrows on each row to instantly jump to the right date and locate your tasks with ease.Need to return to the present? Click the Today icon in the top menu bar to quickly refocus your Gantt chart on the current day.

Show hidden rows in your Gantt chart
If you’ve hidden rows in your Gantt chart—whether by mistake or intentionally—you can easily bring them back. Click the eye icon in the top menu bar to reveal all hidden rows, which appear in light grey.Right-click on any hidden row and select “Show row” from the context menu to restore it. When you’re finished, toggle the eye icon again to hide them from view.
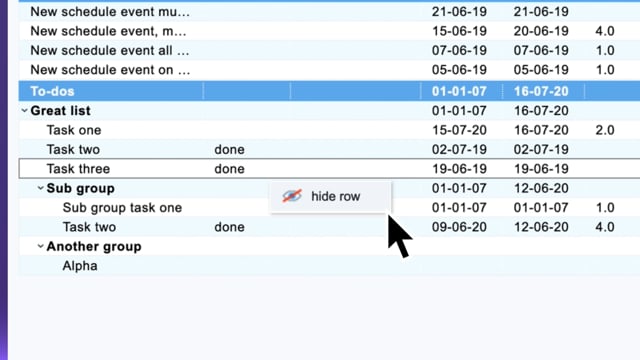
Hide rows to declutter your Gantt chart
Keep your Gantt chart focused by hiding information you don’t need. Right-click on any row and choose “Hide row” from the context menu to remove it from view.Tip: You can also hide entire lists by right-clicking on the list row. All subtasks within that list will automatically be hidden, helping you keep your project timeline clean and uncluttered.
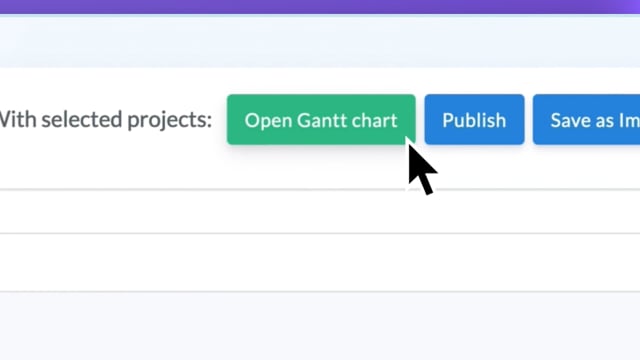
Select and open multiple projects
When you log in to Ganttify, the first page you’ll see is the project list. From here, you can choose which projects to visualize in a Gantt chart.Select one or more rows, then click “Open Gantt chart” to instantly create a timeline of your selected projects. If you’ve opened these projects before, Ganttify remembers your progress so you can continue right where you left off.
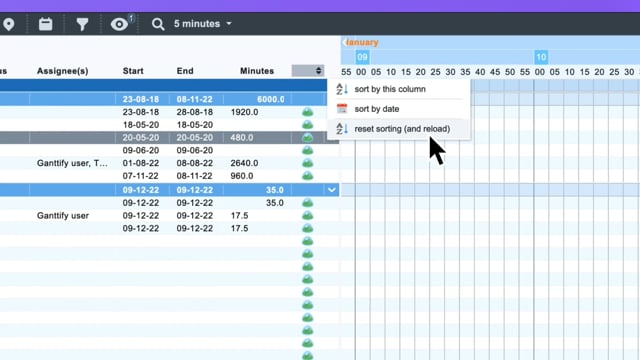
Reset sorting to the default view
Customized sorting is useful, but sometimes you need to reset everything back to the default order. Use the “Reset sorting” option to quickly restore the original view.Simply click the sorting arrows, then select “Reset sorting (and reload)” from the context menu to refresh your Gantt chart with the default arrangement.
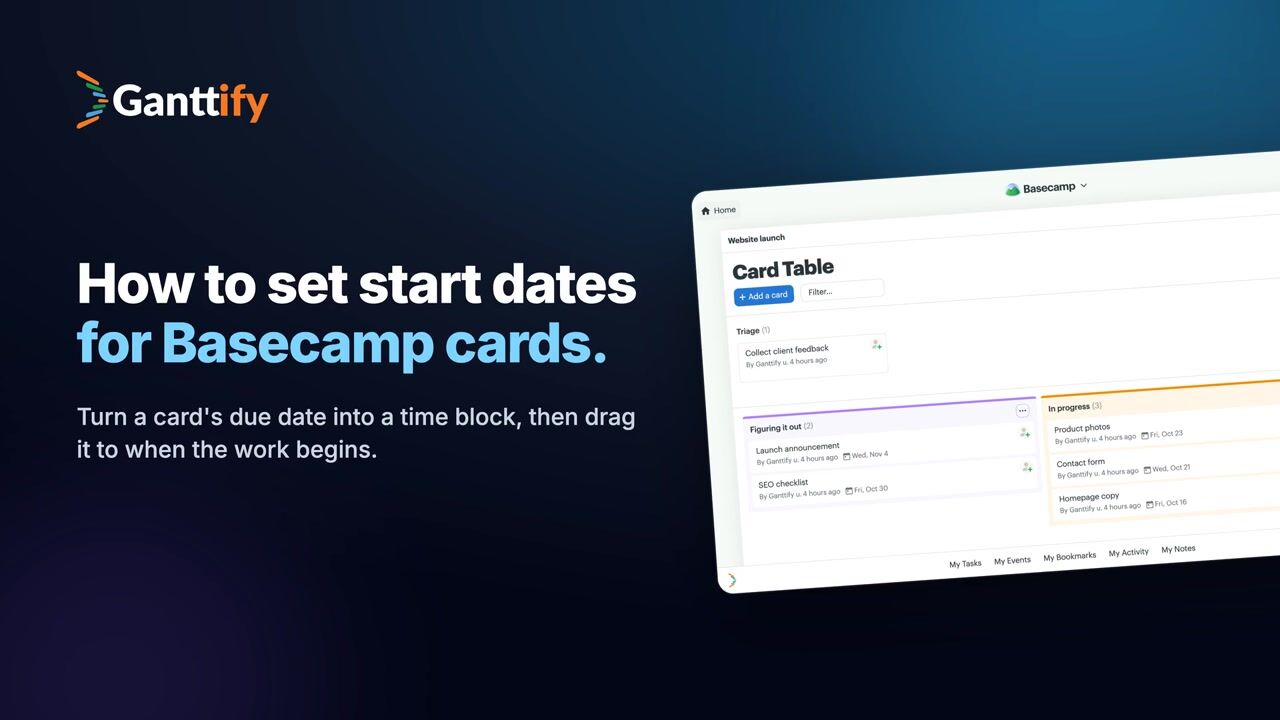
How to set start dates for Basecamp cards
Set start dates for your Basecamp cards in Ganttify: turn a card’s due date into a time block and plan your whole Card Table on one Gantt chart timeline. Your Basecamp Card Table shows when each card is due, and Ganttify lets you plan when the work starts. Open your Basecamp project in Ganttify and every card gets its own row, grouped like your Card Table. A card that only has a due date shows up as a checkmark on that day. To set a start date, right-click the checkmark and choose “Convert to time block”. Drag the block’s left edge to the day the work begins. The block now runs from the start date to the due date, so you can see how long the work will take. If a card needs more time, drag its block’s right edge to a later day. The card’s due date changes in Basecamp too, so your team sees the new deadline. Do this for every card and your whole Basecamp project fits on one timeline, where you can see at a glance which cards run at the same time.
Advanced Features
Guides covering more powerful features like dependencies and workflow enhancements.
Explore more helpful content