



A milestone is the only place in GitHub where scope and a date sit on the same object. Used with some discipline it's a genuine planning primitive. Used loosely it becomes a label with extra steps.
The milestones page on most active repositories holds both kinds. Something like v2.4 , with eleven issues and a due date. And something like Tech debt , with forty-three issues, no due date, opened two years ago. The first is doing work. The second is why people conclude milestones are useless.
What a milestone provides
Three things, precisely. A named bucket for issues and pull requests, a single due date, and a completion percentage. The milestone page shows the due date, the completion percentage, and the number of open and closed items, and nothing else about time.
The progress bar is the underrated part. It's a burndown computed from work the team is closing anyway, with nobody maintaining it and nothing to forget to update. Opening the milestones page and seeing v2.4 at 4 of 11 closed with eight days remaining is a real signal that cost nothing to produce.
What a milestone does not provide is a schedule. Every issue inside it shares one date. On the milestones page a three-day schema migration that everything else waits on and a two-hour copy change look identical: both open, both due the same day. That's exactly the distinction a release needs and exactly the one a milestone can't express.
Sizing and naming
A milestone is useful in proportion to how quickly it surfaces bad news, which argues for keeping them small. A milestone spanning three weeks and eleven issues shows a stalled progress bar within days. One spanning a quarter looks healthy at the same moment, because 4 of 60 closed in week two is normal.
Names should refer to things that ship: a version, a launch, a date. Thematic milestones like Tech debt or Performance never complete, so they never close, so their progress bars never mean anything. Themes are what labels are for.
Due dates belong on the milestone from the moment it's created, even as a guess. An undated milestone can't be drawn as a marker on the roadmap layout, which is the one place GitHub will position it against a timeline at all. A wrong date that gets corrected is more useful than no date.
Where the progress bar misleads
Percentage complete measures volume, not risk. Most of the time the two track each other closely enough to be worth reading. They come apart precisely when a release is in trouble.
An API milestone at 8 of 10 closed looks like a team about to finish. Suppose one of the two open issues is the pricing calculator, and the frontend can't start its settings screen until that lands. That milestone is now the reason the release is at risk. Meanwhile the frontend milestone sits at 5 of 6 and reads as the healthier of the two.
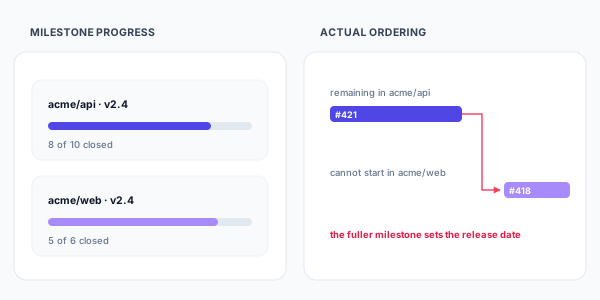
Read side by side, the numbers point at the wrong repository. Repository scope compounds it: milestones track work within a repository, so a release spanning three of them produces three milestones and three progress bars with nothing that adds them together. Whoever is asking about the date does that arithmetic in their head.
Milestones as groups on a timeline
The useful next step keeps milestones exactly as they are and lays them out on a timeline, where each milestone becomes a collapsible group holding its issues and each issue carries its own start and end. The migration and the copy change stop looking alike, and the ordering between them becomes a drawn arrow rather than something to remember.
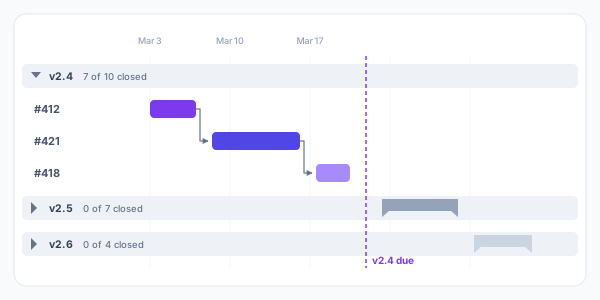
Ganttify reads the selected repositories directly, so the milestones on the chart are the milestones in GitHub. Collapsed, a milestone is a single bar spanning its issues, which is the release-level view. Expanded, it's the schedule underneath, with the blocked-by links already recorded in GitHub drawn as arrows that hold the dates together.
That expresses what a progress bar can't. A slip on the pricing calculator moves the settings screen and the release marker with it, so the risk arrives as a date instead of two percentages that have to be read side by side. Milestones from several repositories sit on the same chart, so nobody does that arithmetic in their head.
GitHub stays the system of record throughout. Dragging a block writes the new date back, closing an issue there advances the progress bar and the chart alike, and the milestones page keeps working for everyone who prefers it. The chart also lives outside GitHub, so it can be published as an always up-to-date, read-only Gantt chart for clients and management, with no repository access needed to read a date.
Trying it
The GitHub integration is in invite-only beta as this is written. Join the waiting list and we'll send an invite as we widen access.